
Overview dashboard
Every card on the main dashboard, what it measures, and the range and model filters.
The Overview is the first screen after sign-in and the one you will spend most time on. This page documents every card and control on it.
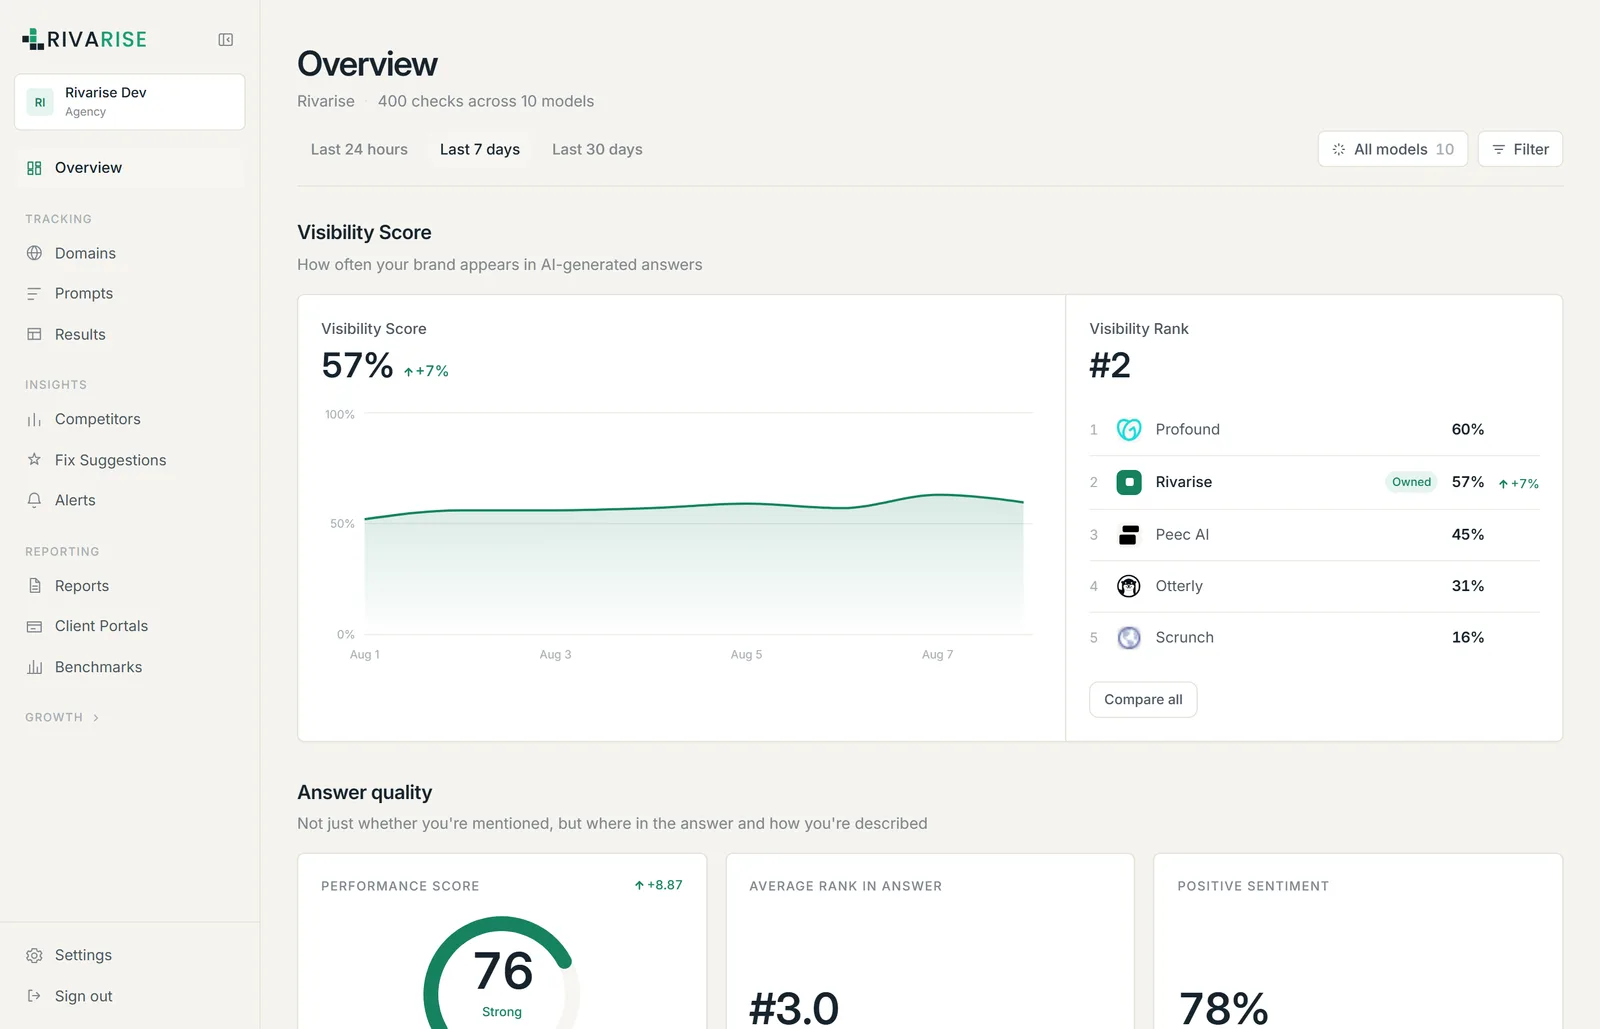
The controls at the top
- Range: Last 24 hours, Last 7 days, Last 30 days. Every figure and chart below recalculates for the selected window. Ranges longer than your plan's history window will simply have less data in them.
- All models. Filters to a single engine. This is the fastest way to answer "which engine is failing us", because the whole page recomputes for that engine alone.
- Filter. Narrows by domain and other dimensions, which matters once you track more than one site.
- Check count. The subtitle shows how many checks the current view is built on. If it looks low, either the range is short or a run has not completed.
Visibility Score
Your citation rate over the selected range, as a percentage, with a delta against the previous equivalent period and a trend line.
The delta is the number to watch day to day. The level tells you where you stand; the delta tells you whether anything changed. On a new workspace the delta is blank or noisy until a prior period exists.
Visibility Rank
You and your tracked competitors, ordered by citation rate over the same range, with your own row marked Owned.
This is usually more informative than the raw percentage. A 57 percent citation rate means little in isolation; being second of five, seven points behind the leader, is a position you can act on. Compare all opens the full side-by-side view described in Competitors.
Answer quality
Three cards that separate being mentioned from being recommended:
| Card | What it shows |
|---|---|
| Performance Score | Your PPS from 0 to 100 as a gauge, with a band label such as Strong or Weak and a delta. |
| Average rank in answer | When cited, how early you appear among the brands named in that answer. Lower is better. |
| Positive sentiment | The share of your citations classified positive. Starter plan and above. |
The useful diagnostic is the relationship between them. High citation rate with a poor average rank means you are always in the conversation and never the recommendation, which is a positioning problem rather than a coverage problem.
Model performance
A per-engine breakdown of citation rate with a trend column, so you can see at a glance which engines cite you and which never do.
Read it for outliers rather than the average. One engine at zero while the rest sit near 50 percent is a specific, investigable fact: open Results, filter to that engine, and read what it cited instead.
Latest answers
A live feed of recent checks with the citation snippet, so you can see the actual wording without leaving the dashboard. This is the single most underused part of the product. Numbers tell you that something changed; the text tells you why.
When the dashboard looks empty
| What you see | Usual cause |
|---|---|
| No data at all | No prompts yet, or the first run has not completed. Add prompts and wait for the next scheduled run. |
| Chart starts partway through | Your history window is shorter than the selected range. Free retains 7 days, Starter 30, Growth 90. |
| A flat line at zero | Genuinely not being cited for those prompts. Read the answers to find out who is. |
| A gap mid-chart | An engine was unavailable for that run. Missing checks are excluded rather than counted as misses. |
| Blank deltas | Not enough history for a prior period comparison yet. |
Next
Continue to Domains, or jump to Results to read the underlying answers.